The Truth About Wood Burning Stoves and Indoor Air Pollution: Examining the Data from London’s Air Quality Monitoring Stations

In light of recent media coverage that casts further doubt on the safety of burning wood in homes, Erica Malkin, communications manager for the SIA, looked further into the numbers from London’s air quality monitoring stations to find out what they really reveal.
After reading the news headlines and listening to the broadcasted debates that have ensued since the Defra data was made public, you might be led to believe that it is strictly forbidden to admit to enjoying the warmth, comfort, and cost-effective energy security that wood burning stoves provide, especially if you live in London!
The data on London’s air quality is readily available. With the London Air website, which is managed by Imperial College London, you may access information from 131 different stations all throughout the city. Each site’s data is accessible via the website’s monitoring area, where you may use drop-down menus to pick air pollutants like PM2.5 and PM10 particles and nitrogen dioxide (NO2) and see that information broken down by monitoring location.
In light of recent news articles and lobbying efforts by groups like Mums for Lungs and the Global Action Plan, Erica decided to track the annual mean values (ug/m3) for PM2.5, PM10, and NO2 at all sites (where possible) for the years 2022 and 2023 to see if the data supports the negative rhetoric surrounding pollution from wood burning in modern Ecodesign stoves.
And a very interesting picture emerged…
All 22 London monitoring sites with data from 2021 were below the current UK legal limit of 20ug/m3 annual mean for PM2.5 (tiny particles caused by things like construction, vehicle traffic, aviation and shipping, agriculture, home and commercial combustion, outdoor burning, and wildfires) in 2022.
The average level recorded for the year so far in 2023 is 13 ug/m3, with 41 out of 42 sites falling below the UK legal limit. Only 7 of the 42 sites measuring PM2.5 have found it to be below the significantly lower former WHO recommended limit of 10 ug/m3 annually mean in 2023. This indicates that in 2022, London’s average PM2.5 level was 10 ug/m3, which is below the WHO recommended limit (at the time).
No monitoring site has recorded PM10 levels this year or last that were higher than the existing UK limit of 40 ug/m3, and several are also well below the WHO suggested limit of 20 ug/m3, which is only HALF the current UK limit.
The average PM10 concentration in 2022 was 19 ug/m3 (across 39 locations), and the average PM10 concentration so far this year is 21 ug/m3, which means that the WHO recommended threshold for PM10 was met in 2022, and is very close to being met in 2019.
When we consider NO2, though, there is little cause for hope. Nineteen percent of London’s monitoring sites have exceeded the UK limit of 40 ug/m3 for NO2 so far this year. These emissions are primarily from vehicles. Of the 109 sites for which data was collected for NO2, 21 exceeded the limit, and the average for all sites was 34 ug/m3, which is within the current UK limits but far below the 20 ug/m3 annual mean recommended by the WHO.
Notwithstanding Sadiq Khan’s recent expansion of the ULEZ, the average levels of NO2 so far in 2023 are higher than the 2022 average of 26 ug/m3.
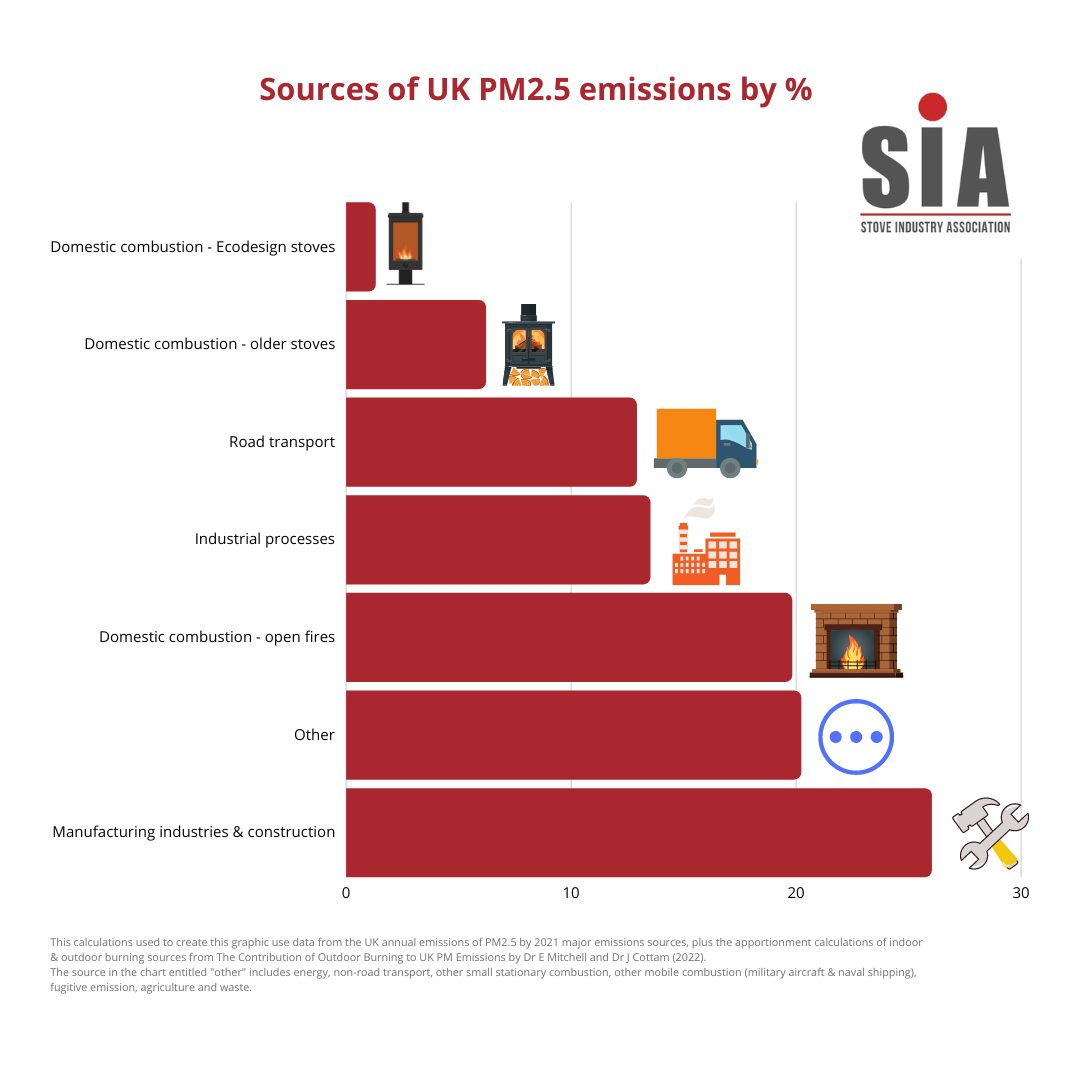
We can all do our part by upgrading to a modern clearSkies 4 or 5 certified stove from a solid fuel open fire or older closed stove to cut emissions from burning wood at home for heat by as much as 90%. From just one industry, that is a significant decrease.
The prospect for such a decrease is quite encouraging for the state of our atmosphere. In addition, the average PM2.5 levels in London last year met the WHO recommended limit (at the time, 10 ug/m3), and data from all the monitoring locations provided on the London Air website indicates that current UK regulations are being met. Last year, yearly mean PM2.5 concentrations were recorded at some LAQN monitoring locations that were very close to the revised WHO standard of 5 ug/m3.
Nonetheless, it is difficult to find even a single column inch devoted to this topic in any major publication.
Press articles describing the “shame” of “wood burner” pollution are not hard to come by, but critics rarely take the time to explain the technical distinctions between open fireplaces, older closed stoves, and modern closed stoves that adhere to Ecodesign standards. Instead, they generalise all fireplaces as “wood burners,” which causes them to gloss over relevant information.
Naturally, we should all do better when it comes to cutting down on pollution. Helping us do better and reduce air pollution due to indoor household combustion is the availability of modern, technologically advanced stoves, combined with effective stove user education, enforcement of Smoke Control Areas, and industry regulation. It’s critical that we “Develop and implement methods to drive a transition away from older, more polluting appliances, to newer appliances which satisfy our strict new emission criteria,” as the recently released Environmental Improvement Plan puts it.
We need to delve past the headlines and examine the air quality monitoring data if we’re going to successfully convey the facts concerning air pollution from indoor household combustion. That is the only way to guarantee that important statistical data is provided without being skewed to fit a preconceived notion or bias.

